
Summary:
This article explains how to interpret the Daily Energy Flow Chart in OpenSolar and how to compare seasonal solar output between November/December and January/February. It highlights why energy production typically increases in the early months of the year and outlines key environmental and system design factors that influence daily performance.
Table of contents:
Daily Output Comparison Between Nov/Dec and Jan/Feb:
🔎 Overview
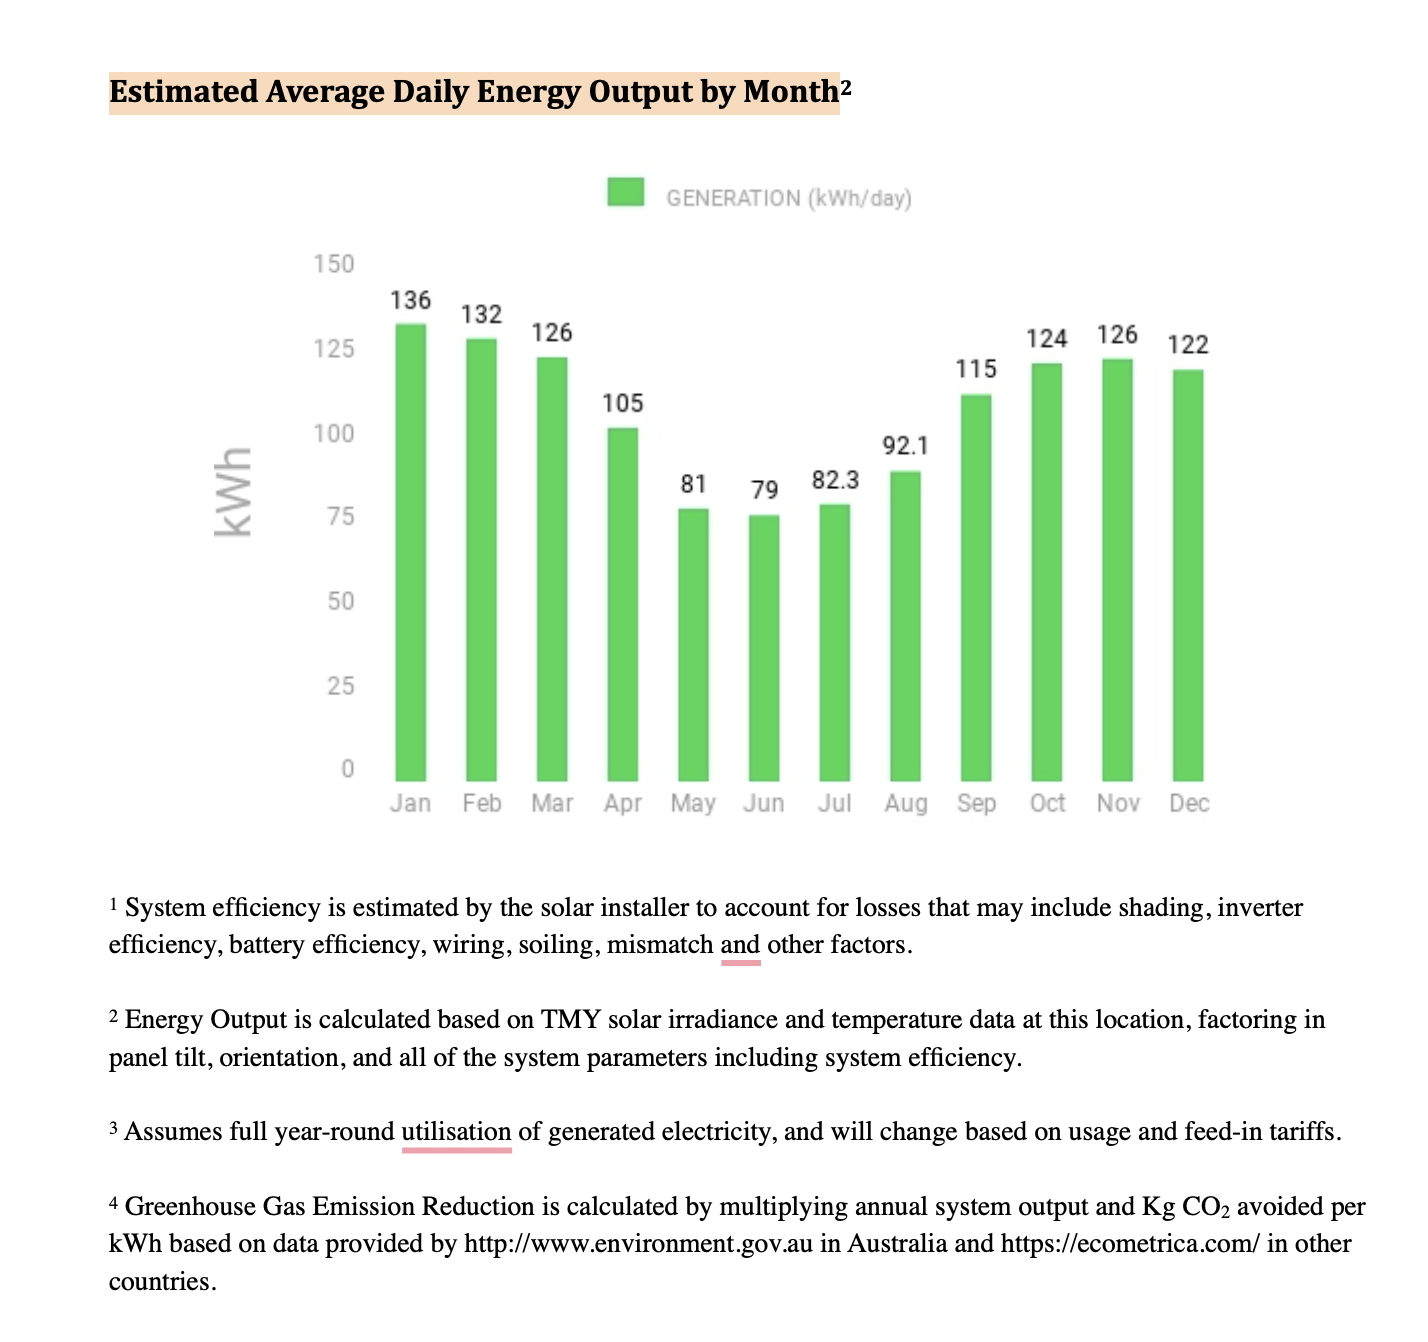
Although November/December and January/February may seem similar in terms of seasonal climate, solar energy production in January and February is typically 10% higher. This difference is especially noticeable in lower latitudes (e.g., -35°) and is influenced by a combination of solar geometry, atmospheric conditions, and system design.
Key Factors Impacting Seasonal Output:
1. Sun Angle
In the Southern Hemisphere, the sun reaches its highest point during January and February.
A higher solar altitude results in more direct sunlight hitting the panels at optimal angles, enhancing irradiance.
In contrast, during November and December, the sun is lower in the sky, leading to a more oblique incidence angle and reduced solar energy capture.
2. Day Length
January and February experience longer daylight hours.
Longer days extend the solar generation window, leading to increased daily output.
Shorter days in November/December reduce total available sunlight.
3. Weather Patterns
December may experience higher weather variability, including increased cloud cover and early-summer storms.
January and February often bring more stable and sunnier conditions, improving overall solar irradiance.
4. Atmospheric Clarity
During peak summer, drier air and lower humidity in January/February improve atmospheric clarity.
This leads to less scattering and absorption of sunlight, enhancing system efficiency.
Higher humidity and haze in November/December may diffuse or reduce available sunlight, even on sunny days.
System Design Factors That Affect Output Variation:
String Inverter Design
In string-inverter systems (vs. microinverters), panels are connected in series.
The entire string’s output is limited by the weakest-performing panel.
This sensitivity can magnify performance differences during months with lower sun angles or cloudier skies.
Lower System Efficiency
-
Systems with inherently lower efficiency have less tolerance for additional losses caused by:
Shading
Oblique sunlight
Diffuse irradiance
These losses are more evident during shoulder seasons (like November/December), compounding overall energy reduction.
Non-linear losses in string-inverted systems often lead to a greater disparity in seasonal performance.
Understanding the Daily Energy Flow Chart:
The Daily Energy Flow Chart provides a visual breakdown of how energy is generated, consumed, stored, and exported within a solar + storage system.
Chart Breakdown
Y-Axis: Displays power in kilowatts (kW).
The chart shows how solar panels, batteries, and the grid interact throughout the day to meet the household’s energy needs.
How to View the Chart
After assigning system equipment in Projects > Design, navigate to the Summary tab.
Scroll down to view the Daily Energy Flow Chart.
If enabled by an admin, this chart also appears in the customer-facing Proposal, under the System Performance section.
Why It Matters
The chart helps you and your customer understand:
When and how solar energy is being used
How much energy is being drawn from or stored in the battery
The balance between self-consumption and grid reliance
The system’s performance at different times of day
Comments
0 comments
Please sign in to leave a comment.